

How to read crypto charts without mistaking history for a forecast
Time range, price scale and daily closes change what a crypto chart appears to say. Learn a few checks before drawing conclusions.
A chart turns a sequence of prices into a picture. It is useful for seeing what happened, but it cannot tell you what will happen next. The same asset can look calm on a one-day view and turbulent over a month. Before interpreting a line, read its units, source and time range.
Check the axes and the time zone
The horizontal axis shows time; the vertical axis shows price or a ratio. A narrow vertical scale can make a small move look dramatic. A chart in USD cannot be compared directly with one in USDT without understanding the quote asset. Daily candles also need a time-zone boundary: this site uses completed UTC daily closes for its historical series.
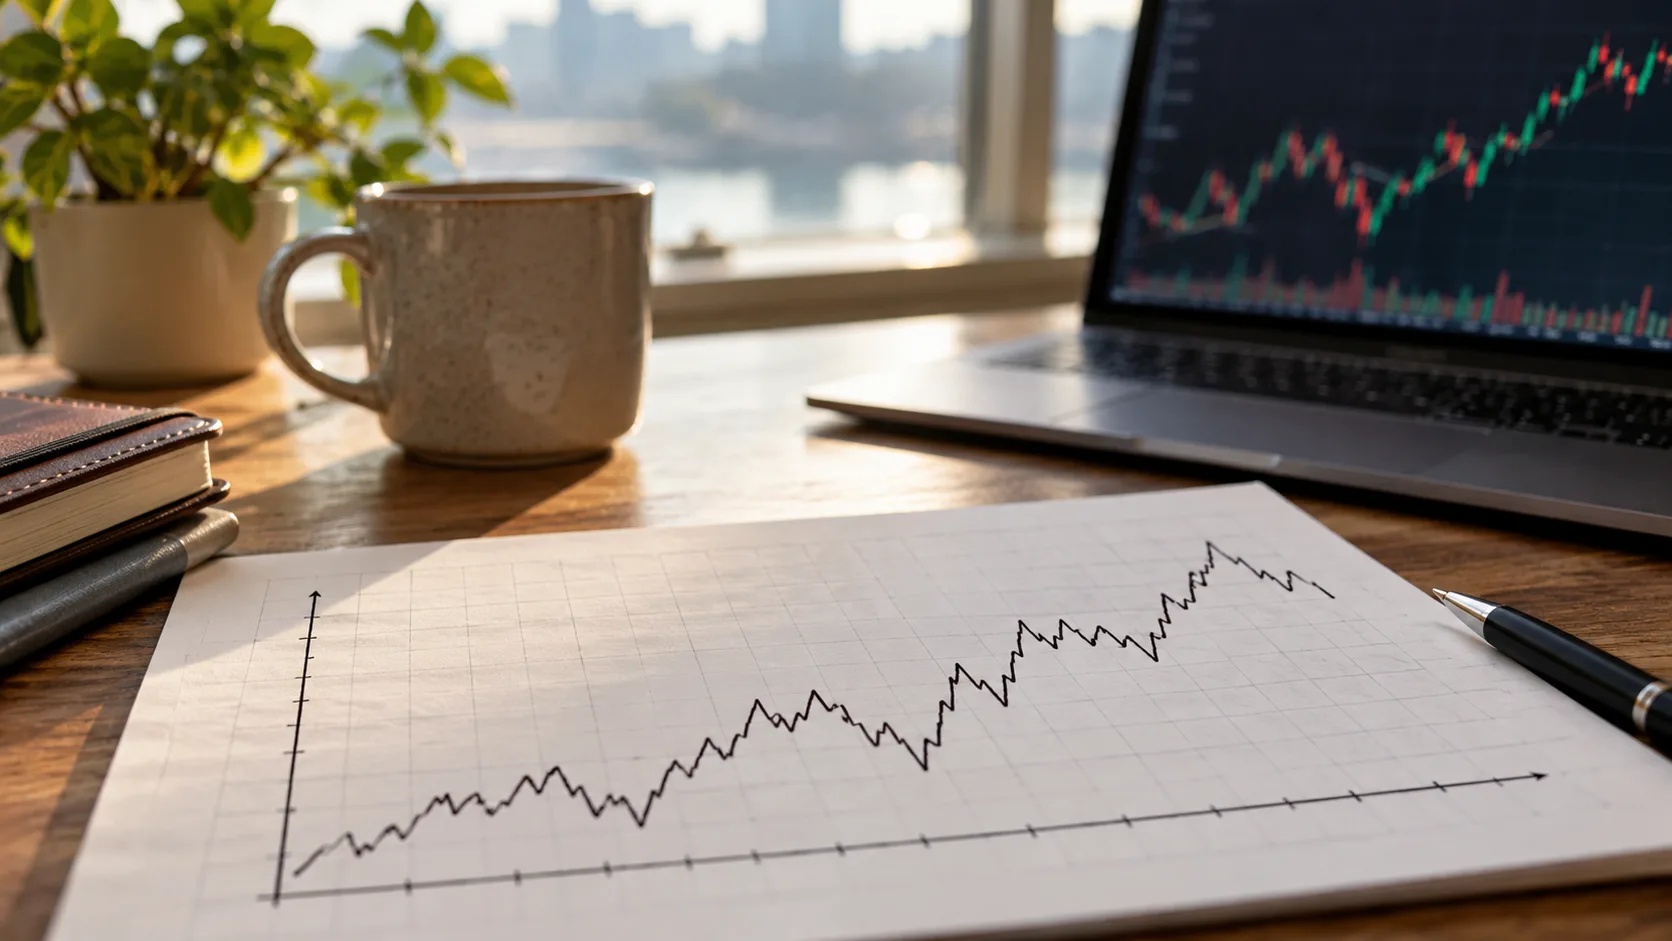
What does a daily close represent?
It is the selected price at the end of a completed day, not the highest or lowest trade that day. A current quote may sit far from yesterday’s close after a fast move. A missing point may mean that the data source did not provide a matching date for both assets.
Three common chart mistakes
- Changing the window: compare the same time span before ranking two assets.
- Ignoring the quote: BTC/USDT and USDT/BTC move in opposite numerical directions.
- Treating a pattern as a rule: a past rebound does not make the next one certain.
For a cross pair, the line may be a ratio of two underlying USDT series rather than direct trades in that pair. If both assets rise together, the ratio can remain flat; if one rises faster, the ratio changes. That is different from looking at either coin alone.
Connect the chart to the amount you need
On a BTC/USDT pair page, the large conversion number uses a recent cached quote while the chart uses completed daily closes. The two should not be expected to match. Use the calculator for the current reference amount, and check the venue’s live order book before trading. A chart helps frame questions; it does not replace risk limits or a decision process.
Volume, when available from a trustworthy source, tells you how much was traded in the chosen interval; it does not explain why the price moved. Be careful with screenshots that hide the dates or crop the scale. Keep a note of the exact pair and period you are viewing. If you cannot reproduce a chart from its source, do not use it as the sole basis for a decision.
Two charts can also use different data providers. Compare their timestamps and definitions before treating a small gap as an error.
It helps to write one factual observation before making an interpretation: for example, “this close was higher than the previous close” is observable, while “the market must keep rising” is a forecast. Separating the two prevents a graph from becoming a substitute for evidence.
Further reading: Binance Spot market data documentation.


